What is Logarithm
A logarithm is an inverse function of exponentiation. A simplified way of saying the same would be, that a logarithm is the opposite of an exponent. E.g.
The exponent form 2^3 = 8 can be written in its (opposite) logarithm form as \log_2 8 = 3
Let us describe the above mathematical forms in their simple English equivalents.
2^3 = 8, asks the question what will be the value if 2 grows 3 times? Answer is 8
\log_2 8 = 3, asks the question how many times will 2 have to grow to reach 8? The answer is 3 times
What is Natural Logarithm?
A natural logarithm is a special case of logarithm which has Euler’s constant (e) as its base. Mathematically Euler’s constant can be written as e^x. If we convert this into logarithmic form, we get the natural log.
e^x = a ==> \log_e a = x
The logarithm form is denoted as ln(a), which is called natural log.
Let us describe these mathematical forms in their simple English equivalent.
e^x = a , asks the question what will be the value if e grows x times ? Answer is a
ln(a) ==> \log_e a = x , asks the question how many times will e have to grow to reach a> Answer is x times.
Practical Application of Logarithm
Logarithms have practical applications in the following:
Scaling in Graphs
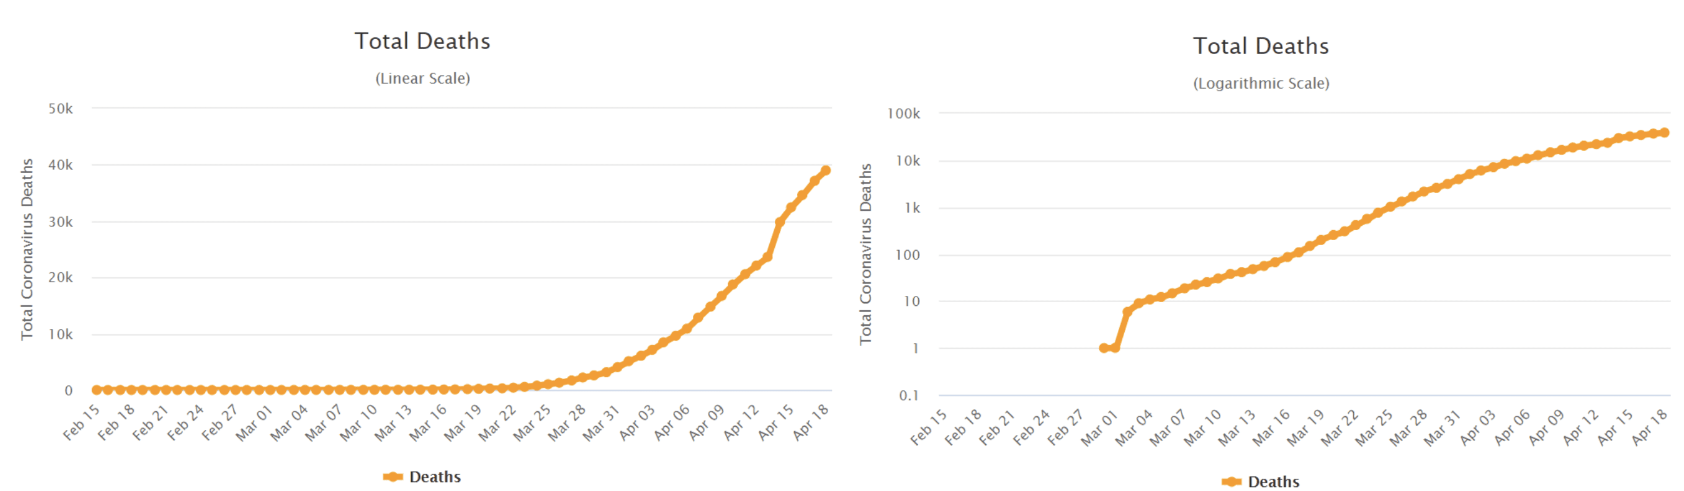
In graphs, logarithms are used for displaying a large range of values in compact space. For example, consider this covid death data plotted in both linear and log axis. The left side shows linear scale of deaths on Y-Axis. The right side graph shows logarithmic scale of deaths on Y-Axis. We have used logarithm to compact the size of the Y-Axis.
It is interesting to note that about 60% of the respondent in a recent survey by LSE did not understand what was being explained by a logarithmic graph. In another interesting article, Mordechai Rorvig explains the dynamics of log scale graphing and the cautions required in reading the logarithm axis.
Measurement scales
Logarithms are used in measurement scales where calculations require taking values over a large range into consideration. A few examples of measurement scales engaging logarithms are
Ritcher scale for earthquake monitoring
The Richter scale is logarithmic and uses a base of 10, meaning that whole-number jumps indicate a tenfold increase. In this case, the increase is in wave amplitude. That is, the wave amplitude in a level 6 earthquake is 10 times greater than in a level 5 earthquake, and the amplitude increases 100 times between a level 7 earthquake and a level 9 earthquake.
Google page rank algorithm
Google’s page rank algorithm shows the relative authority and traffic of a website on a scale between 0 -10. A higher number means higher traffic. The PageRank score is a logarithmic score. The actual calculation takes a lot of factors into account e.g. backlinks, referring domains, pr quality, authority score, etc. For this illustration, I have only taken traffic as an indicator. The two columns with log values calculate the rank with base 10 and 6 respectively. The main idea here is that we can use logarithms to represent a large-scale variation with a smaller number which makes intuitive sense for readers.
| Domain | Monthly visits (similarweb.com) | log10(x)=Pagerank | log6(x)=Pagerank | Estimated Google Pagerank (checkpagerank.net) |
|---|---|---|---|---|
| cnn.com | 524,000,000 | 8.7 | 11.2 | 9 |
| latrobe.edu.au | 22,000,000 | 7.3 | 9.4 | 6 |
Growth & decay
Logarithmic growth is the inverse of exponential growth and is very slow. Exponential growth starts slowly and then speeds up. Logarithmic growth starts fast and then slows down.
The function of logarithmic growth describes a relationship where the result can be described as a log function of input
f(t)= A.Log(t) + BThe confusion between logarithmic growth and exponential growth can be explained by the fact that exponential growth curves may be straightened by plotting them using a logarithmic scale for the growth axis.