Azure machine learning studio provides an easy-to-use interface for data scientists and developers to build train and productionise machine learning models. Another major benefit it provides is the ease of collaboration and
In this article, we will explore how to solve a machine learning problem with Azure Machine Learning Designer.
Defining the Problem
To solve the problem via Azure ML Studio. We need to do the following steps
- Create a Pipeline,
- Set pipeline’s compute target.
- Importing Data
- Transforming Data
- Train the Model
- Testing the Model
- Evaluate the Model
Creating pipeline using ML Designer
Azure machine learning pipelines are workflows of executable steps that enable users to complete Machine Learning workflows. Executable steps in azure pipelines include data import, transformation, feature engineering, model training, model optimisation, deployment etc.
There are 3 ways of creating pipelines in Azure Machine learning Studio
- Using Code ( Python SDK )
- Using Auto ML
- Using ML Designer.
- When we login to Azure ML Studio , we see the following options.
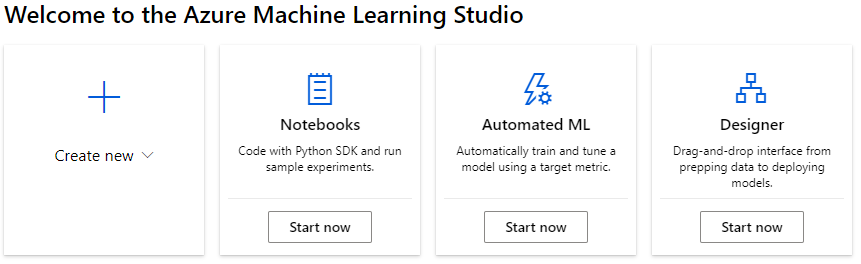
- Click on Designer (Start Now) to create a new Pipeline.
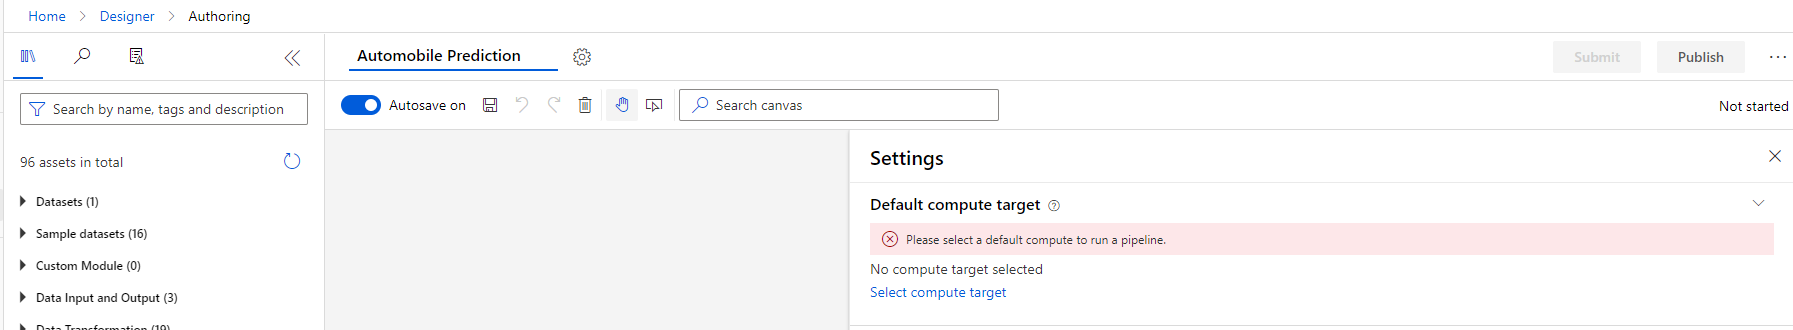
By default it’s given a name based on today’s date. I have changed it to Automobile Prediction.
Setting Compute Target
A compute target is an instance of Azure virtual machine which will be used to provide processing power for our pipeline execution.
Default compute target will be used for entire pipeline, we can also use separate compute targets for individual steps of execution.
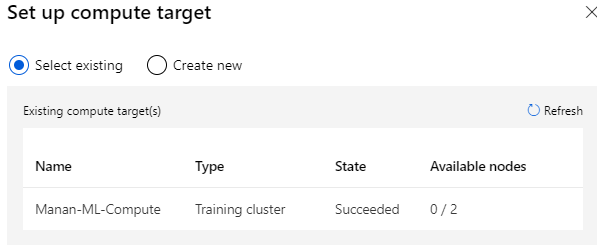
I created a compute instance earlier, so I can select existing
Importing Data
We can import the data from several sources. For this article, I will use sample datasets provided by Azure.
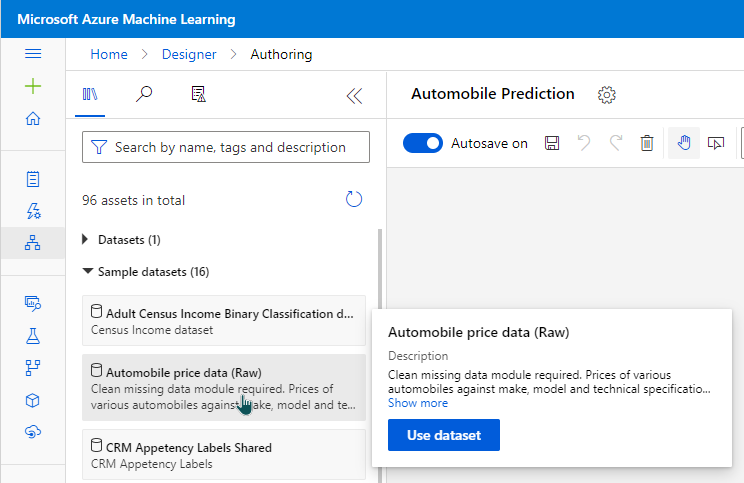
To explore what is in the data set, we can click on the data set and go to preview data.
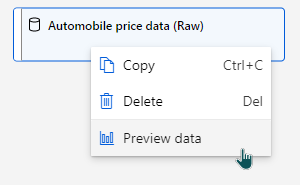
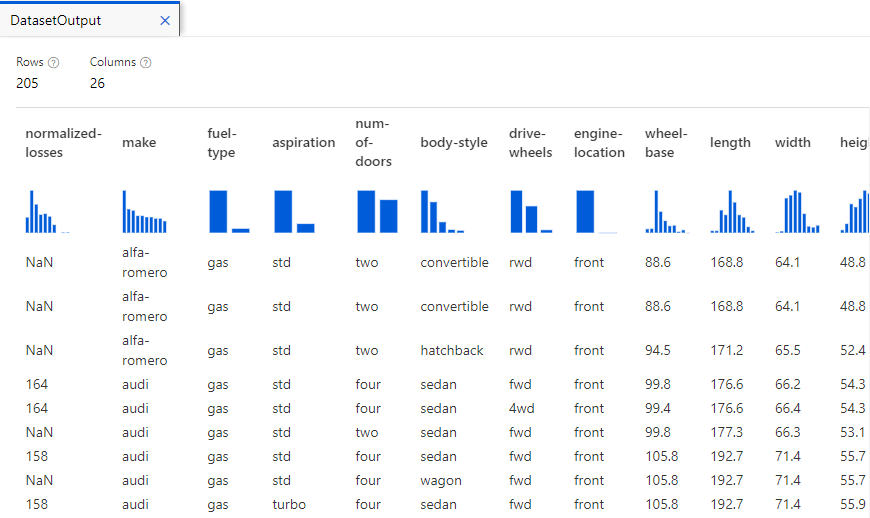
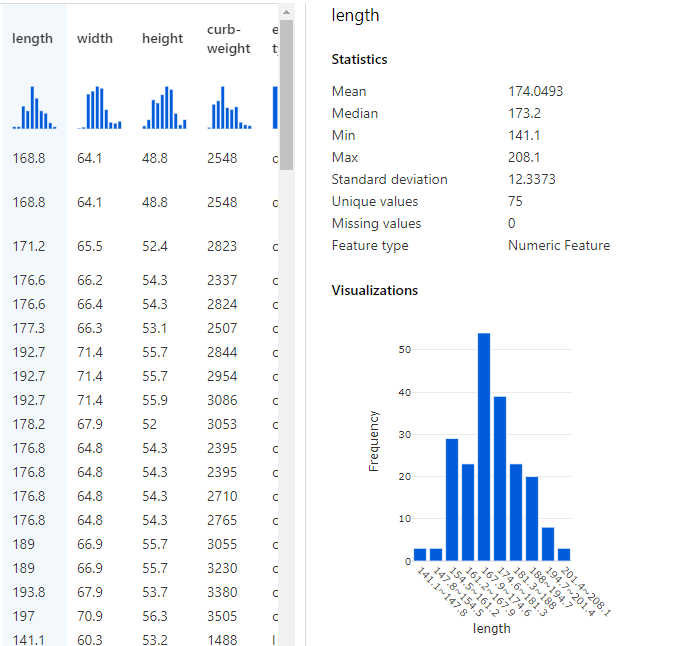
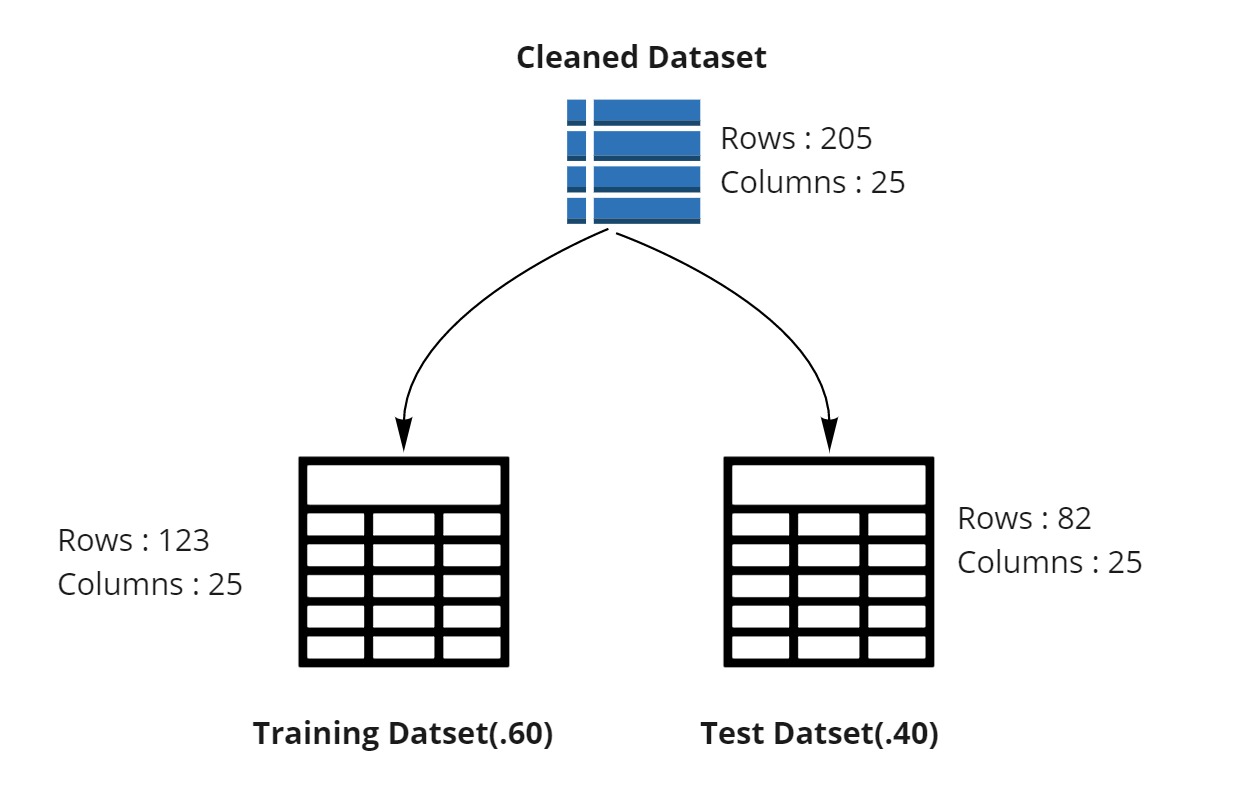
This provides us a sneak-preview of what’s included in the data. E.g. there are 205 rows, 26 columns. Clicking on each column provides key statistics about data in that specific column. E.g. If I click on length column, I get a histogram showing the frequency of length values and various other statistics about it.
Transform Data
The data preview feature is helpful in understanding the columns and transforming data for any characteristics necessary to run our model.
Exclude a column
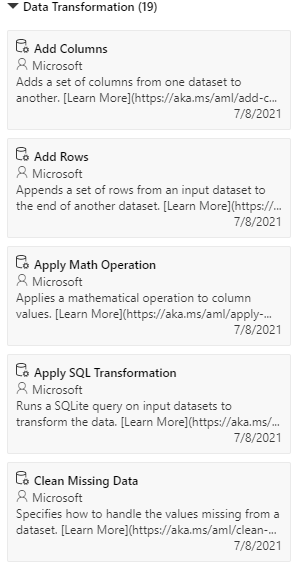
The data transformation section on left side menu provides several commonly used data transformation operations.
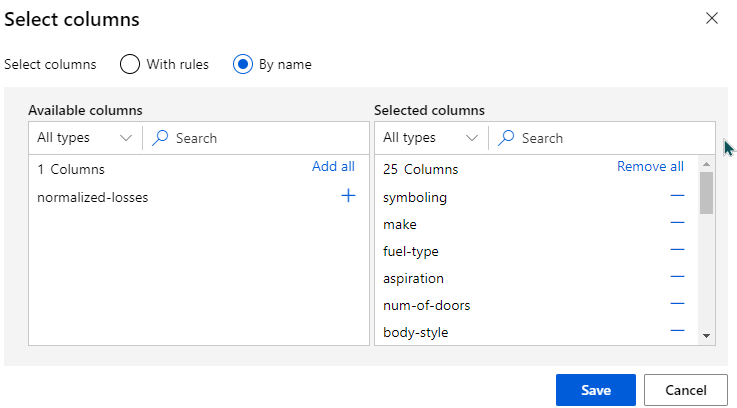
I want to remove the column normalized-losses
So, I can drag and drop “Select Columns in Dataset”
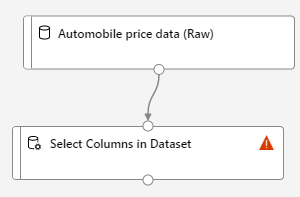
When I go to the details of “Select Columns in Dataset” , I can then select all columns other than normalized losses
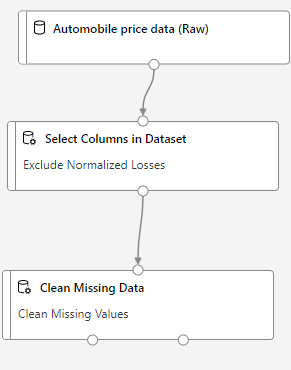
Clean Missing Data
After removing the normalized-losses columns, our data still has empty values. To clean the missing data. I can use Clean Missing Data module from left side menu. So that our worspace looks like
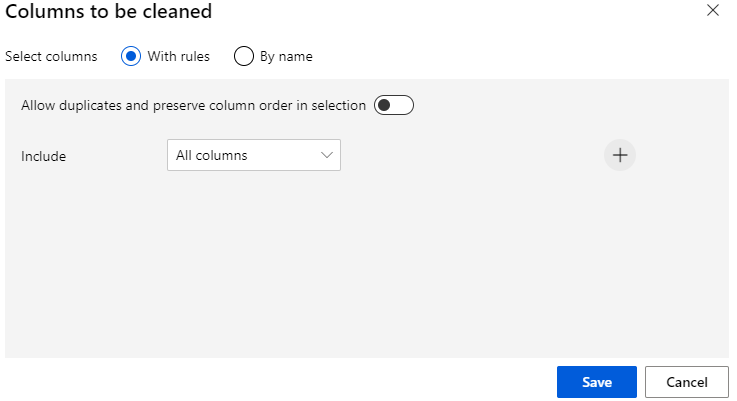
Going into details of Cleaning missing data, I can select Alll columns.
Training the Model
I want to divide my dataset rows into
- Training rows (training dataset)
- Testing rows (testing dataset)
I can use Split Data Module from left side menu, so that my pipeline will now look like :
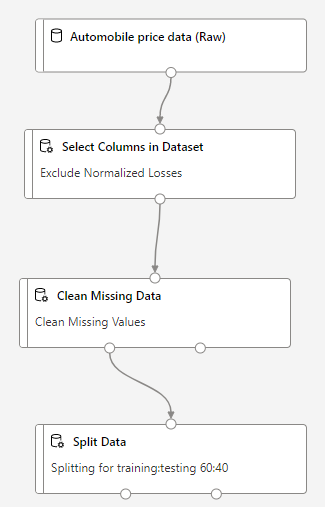
The Split Data module has 2 outputs. The left outputwill connect to Train Model and Right output will connect to Test Data.
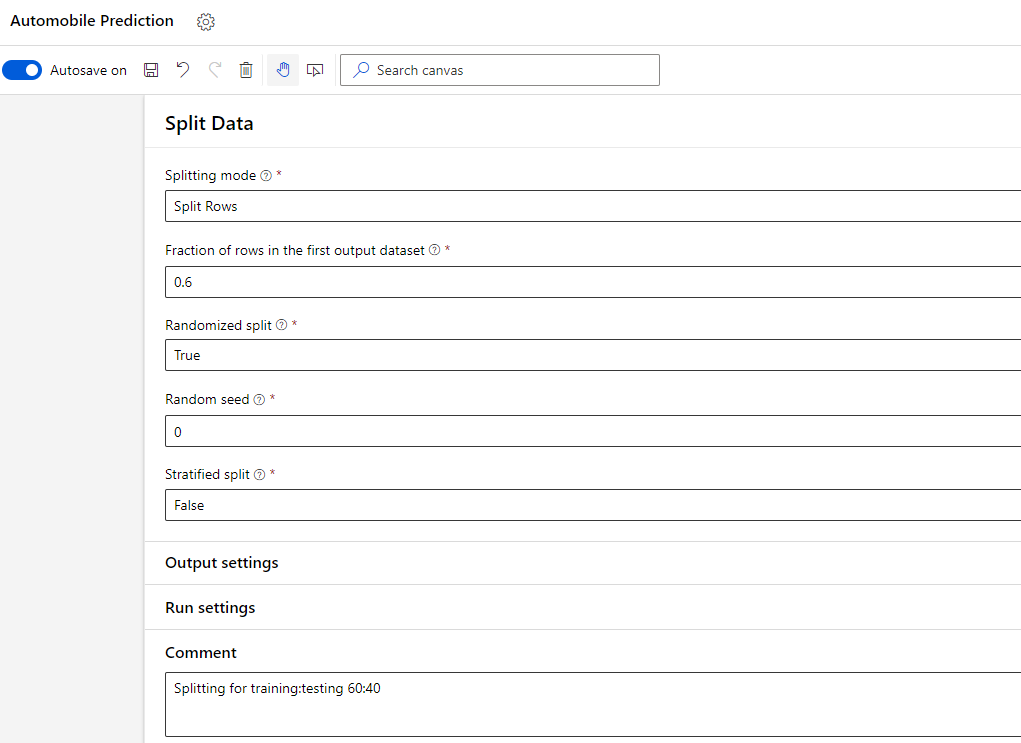
In the details of Split Data module, I can choose the ratio with which I want to split the data across training and testing.
In summary, we cleaned the dataset and then divided it into two separate one as shown in the image below.
Training the Model
To train any model, we need to have.
- The model
- The data on which model is to be trained.
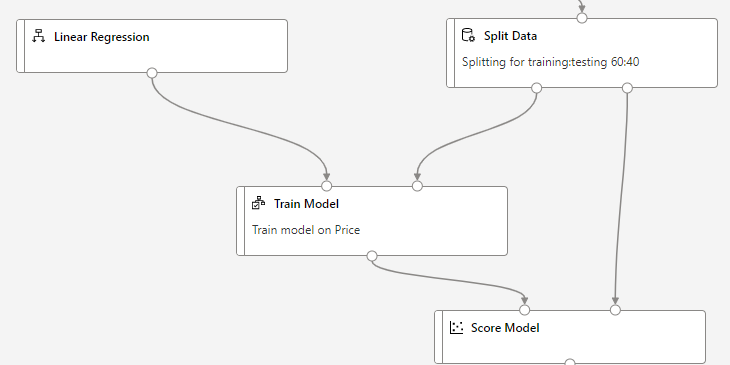
In our case, we want to predict automobile prices using Linear Regression Model. The training data for Linear Regression Model is the one which we have split from our overall data.
Therefore, we can train our model by combination of Linear Regression module and Train Model module from left side menu.
The Train Model module requires a label to train the model for. A label in this case is independent variable? with the help of which we can find the dependent variable.
[From y = mx + c , a label is X ]
Testing the Model
In Split Data step above, we used only 60 % of our data for training the model. We left remaining 40% of the data for testing. We can setup the testing now by using Score Model module.
Score Model module will need two input.
- What needs to be tested (output of our trained model)
- With what to test (test data from split)
This will look like:
Evaluating the Model
Now we want to see how our model scored when compared against the test dataset. We can use Evaluate Model module and connect Score Model module to it.
This will finish our pipeline creation. We now need to submit it.
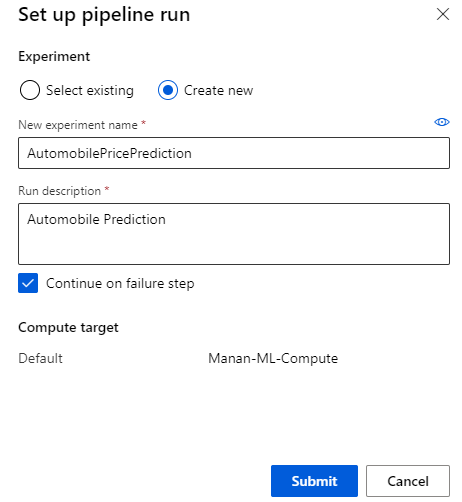
Pipeline Submission
Pipeline submission will create an experiment name and compute target.
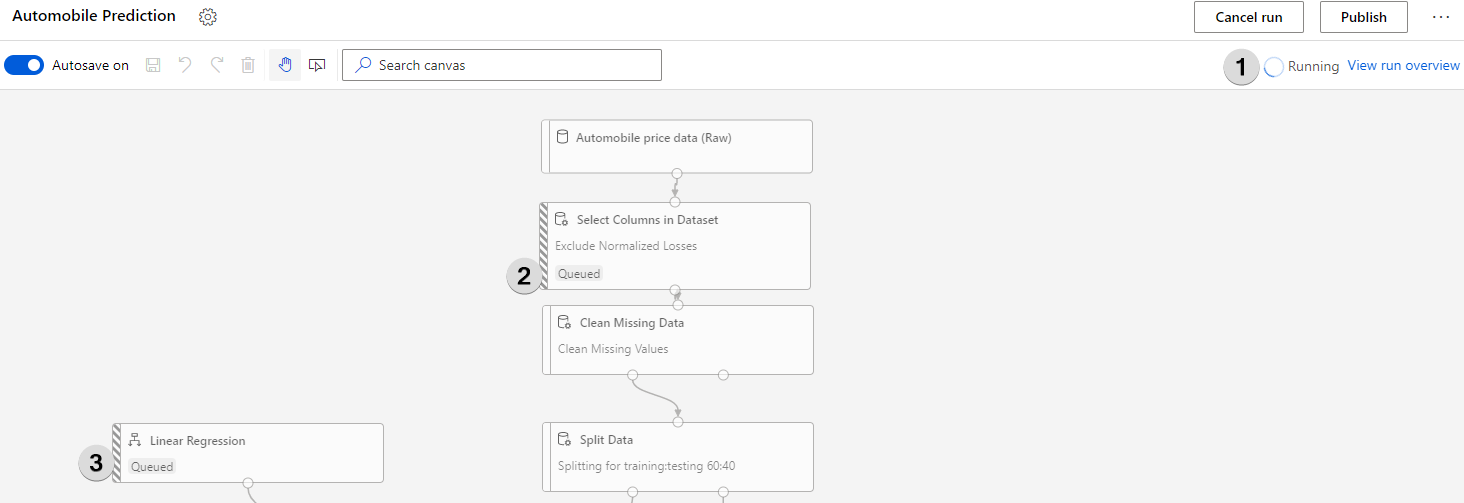
Understanding the Predictions
Azure ML takes a bit of time especially if the experiment is run for the first time. You can view the progress by looking at the “Running” status (1) or by looking at what’s the status of each individual module ( 2, 3).
Once the model finishes it run, right-click on Score Model and select Visualize > Scored dataset
In the Scored Labels column, you can see the predicted prices.
Understanding Models efficiency
We can use Evaluate Model to see the efficiency of the trained mode.
Right click Evaluate Model -> Visualize -> Evaluation Results
The following statistics are available.
- Mean Absolute Error
- Root Mean Squared Error
- Relative Absolute Error
- Relative Squared Error
- Coefficient Determination